
More data. Smarter tech. Still stuck.

What’s getting in your way?

Pick the one that sounds all too familiar.

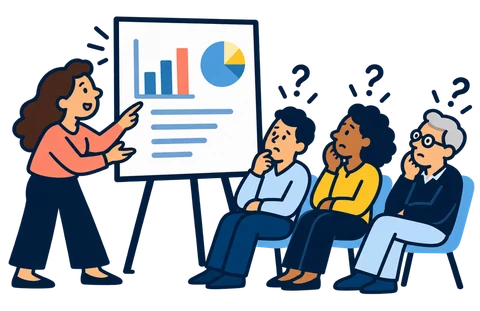
Presenter explaining charts to a puzzled audience

Data galore. But what’s the story?

We’ve presented the numbers six different ways. They’re still asking what it all means.

You’ve already done the analysis. Now you need other people to understand what it says.

We’ll start with your audience. What do they need to understand or decide? Then we’ll work backward to find the clearest way to communicate it. Sometimes that means rethinking the measures. Sometimes it’s a better visualization. And sometimes it’s simply clarifying what people were asking for in the first place.


Let’s talk

Three hikers climbing a mountain toward a flag

We’re doing the work. But how do we show it’s working?

There’s a plan, a deadline, or someone asking for results. Now what?

You’ve got a strategic plan, a growing list of accomplishments, and a deadline to report progress. But completing projects isn’t necessarily the same as changing outcomes.

I can help you identify what you’re actually trying to change, what evidence would tell us whether it’s happening, and how to collect and report that information without needing full-time staff to do the heavy lifting.

Let’s talk

Two grumpy server racks with crossed arms and disconnected cables

Our data systems aren’t on speaking terms.

The cost numbers exist. The hiring data exists. So why is calculating cost per hire such a production?

All the pieces are there. They’re just scattered across different systems, with different definitions and nobody quite agrees how they fit together.

We’ll figure out which information needs to connect, where it lives, and what’s keeping it apart. Then I’ll build a reliable, repeatable way to connect the pieces.

Not every disagreement requires a technology overhaul. Sometimes a little conflict resolution will do.

Let’s talk

Three colleagues around a laptop, discussing charts and notes on the table

This project could use a little backup.

You’ve got the project covered, but could use an extra set of hands on the data piece.

Sometimes a project calls for a particular piece of work that could benefit from another set of eyes, hands, or ideas.

Maybe you’re putting together a funding proposal that needs a stronger evidence base. Developing an outcomes framework for a new program. Or promising a client a dashboard and wondering who’s going to build it.

I can join your team for the part where data, measurement, and analysis come into play. I’ll learn enough about the project to contribute thoughtfully, work with the tools and people already involved, and help produce something useful that fits the larger effort.

Let’s talk

How can we break through?

A few examples of what we could figure out, fix, or build together.

  1. Project Data Support

    Bring KPi into an existing project for outcomes measurement, analysis, reporting, or another defined piece of data work.

  2. Data Diagnostic

    An assessment of your existing data and reporting setup, with a prioritized list of gaps and recommendations.

  3. Reporting Makeover

    A redesigned report, dashboard, or board packet, plus reusable templates for keeping it updated.

  4. Measurement Starter Kit

    A set of defined indicators, mapped to available data, with a workable reporting process.

  5. Data Connection Project

    A repeatable way to combine information across systems, with documentation so it can be maintained.

Who’s behind KPi?

Kim Priddy, founder of KPi, smiling in a navy blazer

I’m Kim Priddy. I help organizations ask better questions and build the data capabilities to answer them.

I took a winding route here through journalism, sports television, nonprofit programs, market research, and finance. Somewhere along the way, I discovered that my favorite place to work is between disciplines: technology and operations, strategy and implementation, data and the people trying to use it.

For the past decade, I’ve built business intelligence capabilities, data systems, and approaches to measuring performance in the public sector. I’m happiest untangling complicated problems and turning them into something practical that people can actually use.

I live in Northern Colorado with my three boys. Outside of work, there’s a lot of reading, chasing kids, occasional napping, and software projects that tend to get completely out of hand. Ask me about my vibe coding projects if you have a few hours to spare.

You’ll know I’m onto something when I say...

  • “Lemme ask you THIS...”
  • “Wait. Why are we doing it that way?”
  • “I made a diagram to explain this.”
  • “I’ve been doing some thinking...” (famous last words)

Let’s talk.

Tell me what’s going on. We can figure out where to start.

Prefer email? kim@kimpriddyinsights.com